Creating Graphs
-
 From the Dashboard or the Metrics tab of the project page, click the New Graph icon.
-
On the New Graph dialog, select the metric you want to graph.
-
For a complete list of options, see Metric and Graph Types.
-
-
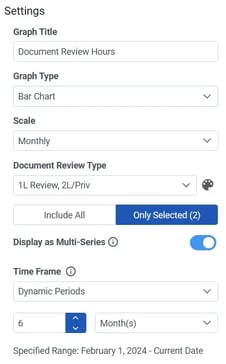
Adjust the graph settings using the Advanced Settings button, if desired.
-
Graph Title
-
Text that displays above the graph tile.
-
-
Graph Type
-
Format used to display the metric. Choices will vary based on the metric chosen. See Metric and Graph Types for examples of each type.
-
-
Time Frame
-
Date range of metrics to display. Project Lifetime, or a specific date range.
-
-
Scale (available on some graph types)
-
Date range by which metrics should be grouped, such as daily, monthly, quarterly, yearly.
-
-
Other settings, based on graph type and metric.
-
-
Click the Add Graph button to save your settings and add the graph to the Metrics tab.
Arranging Graph Tiles
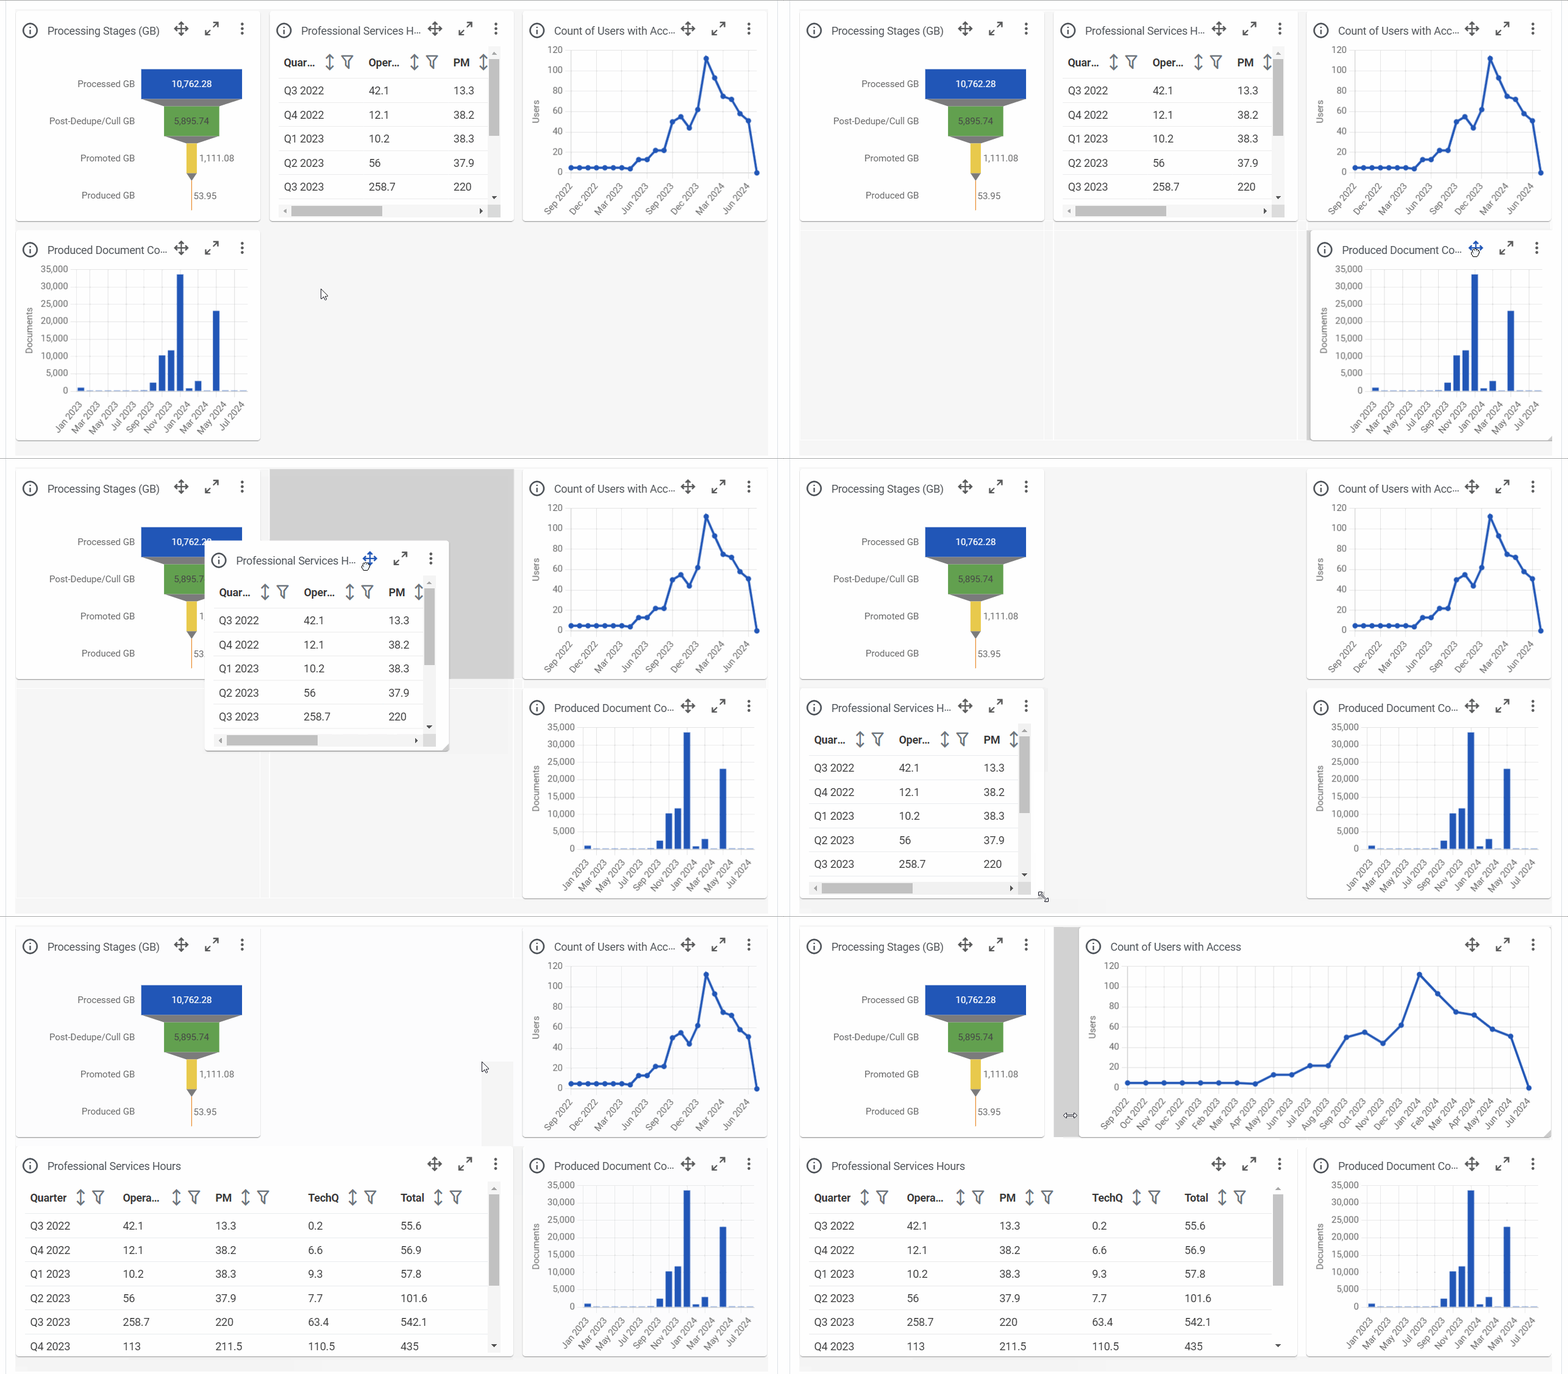
Graphs on the Dashboard and Metrics tab are displayed on tiles and there are nine locations where graph tiles can be placed, arranged in a grid configuration. Within this grid, graph tiles can be moved and resized as desired. Once all nine locations are occupied, new graphs cannot be added unless others are deleted or resized.
Moving Graph Tiles
-
Click and hold the tile’s Move icon, then drag the tile to the desired location on the grid.
-
You can only move tiles to locations on the grid that are not already occupied by another tile.
-
Resizing Graph Tiles
-
Click and hold any corner of the graph's tile. Your cursor will change to a diagonal, double-sided arrow to indicate the tile can be resized.
-
Drag to resize the to the desired size and shape.
-
You can only resize tiles into grid locations that are not already occupied by another tile.
-
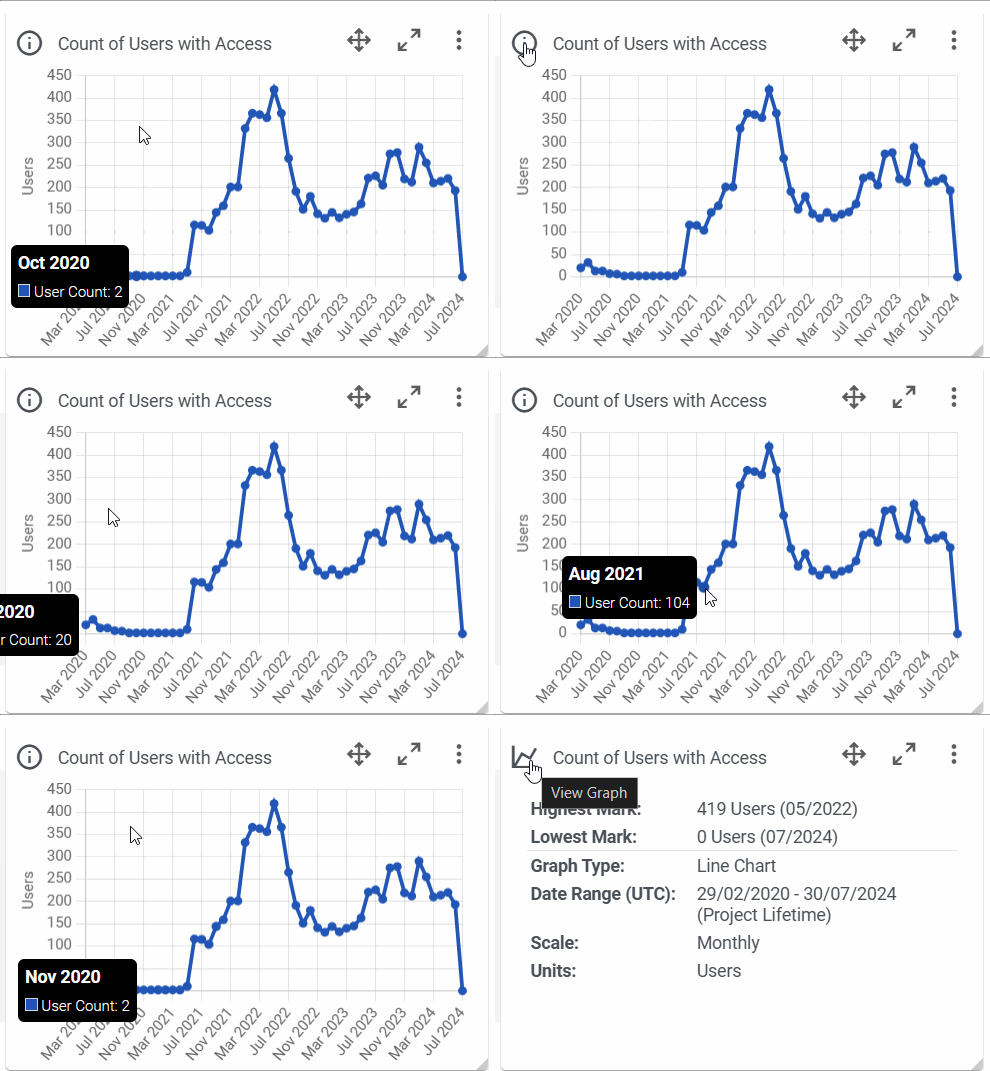
Viewing Graph Details
-
Click on the Graph Details icon to display information about the graph and related metric.
-
The fields displayed will vary based on the metric shown and the type of graph selected, as well as the graph settings.
-
-
Click the Metric icon to return to the graph view.
Deleting Graphs
-
Click the graph’s Action button and select Delete.
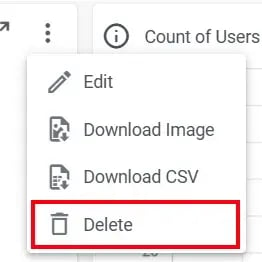
- On the Confirm Graph Deletion dialog, click Yes.
Editing Graphs
Graph settings can be updated after they have been created:
-
Click the graph’s Action button and select Edit.
-
Adjust the graph settings as desired.
-
See Creating Graphs above for more information on graph settings.
-
-
If desired, click the Change Metrics button to select a new metric for the graph.
-
Click the Save button to save the changes to the graph.
Downloading Graphs
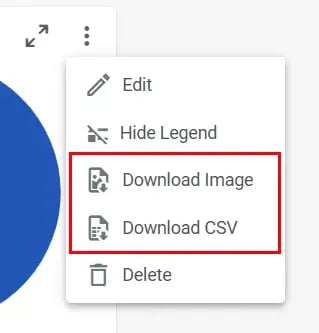
Graphs can be downloaded in either image (PNG) or comma-separated values (CSV) format. To download a graph:
-
Click the graph’s Action button and select Download Image or Download CSV.
-
The download will begin immediately.
-
Files downloaded will be named for the Graph Title.
-
Image downloads will contain an image of the graph as it is displayed on the Metrics tab.
-
CSV downloads will contain the data used to display the graph.
-
Expanding Graphs
Graphs can be expanded into a standalone window to increase the amount of space available to view the graph or to view it on a secondary display.
-
Click the Expand button at the top of the graph tile.