-
Dashboard filter settings are saved within each users’ session. Any filter, project selection, or page-display configurations made on the dashboard will remain in place until the user logs out. Previously, going into a project or leaving the page would remove any filers or configuration settings.
-
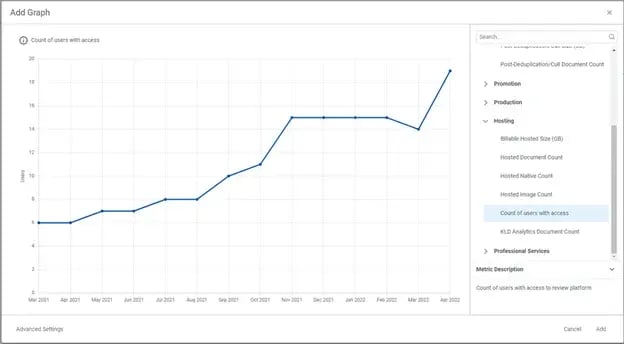
You can now preview graphs when selecting them. While browsing the available metric types, clicking on each one will render a live preview of that graph and include a description of what that graph represents.
-
You can also now edit graphs while you add them. Previously, you had to save the graph and then go back into the graph to edit the settings. Now, when adding a graph, simply clicking the “Advanced Settings” button will bring you to the configuration screen to allow you to customize the graph while saving it.
-
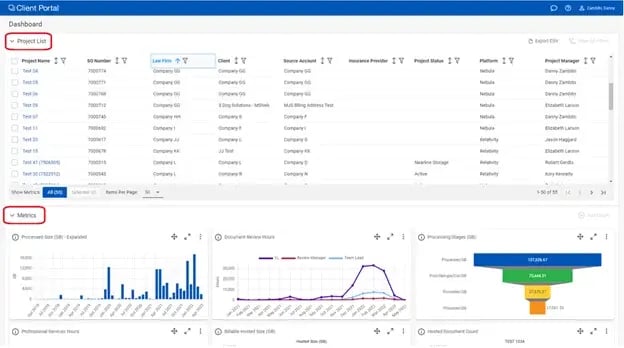
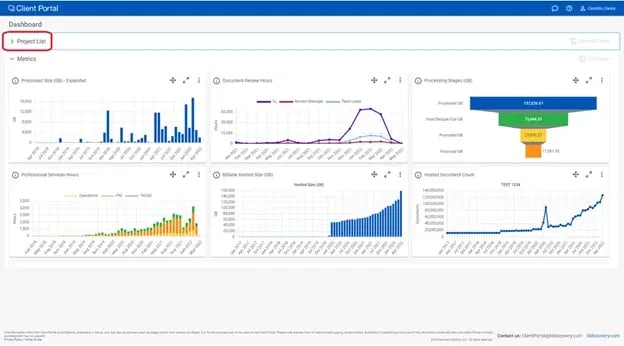
Collapsible Dashboard Sections. The “Project List” and “Metrics” sections on the dashboard can each be collapsed to give the user a larger view of one-or-the-other.
-
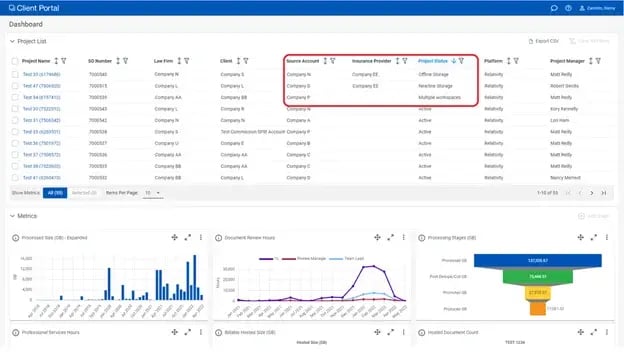
New & updated columns added to the dashboard. Insurance Provider & Source Account have been added to the dashboard and the “Billing Status” field has been updated to “Project Status” and shows a more granular view of each project’s status.
-
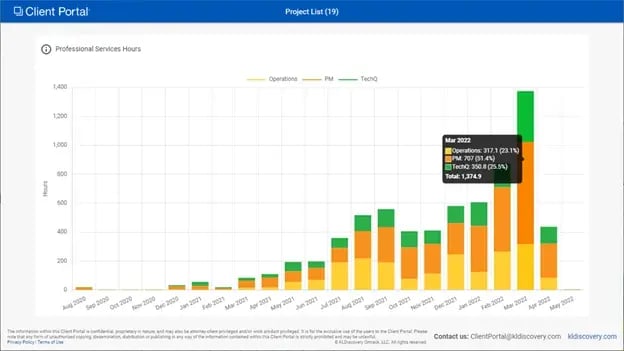
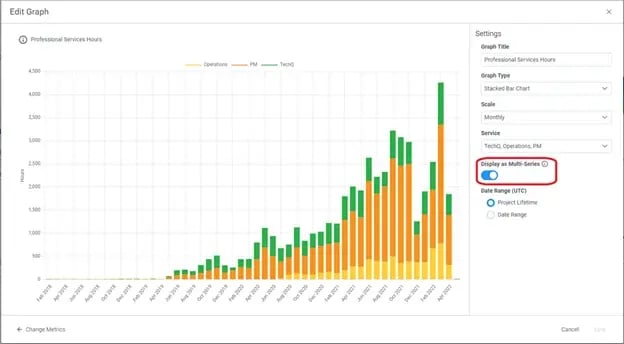
The user experience with multi-series graphs has been improved. Graphs will now display the percentage that each segment represents and will hide any series that do not apply to that specific graph. Additionally, we have made the process of toggling between multi-series and single-series graphs more intuitive.