-
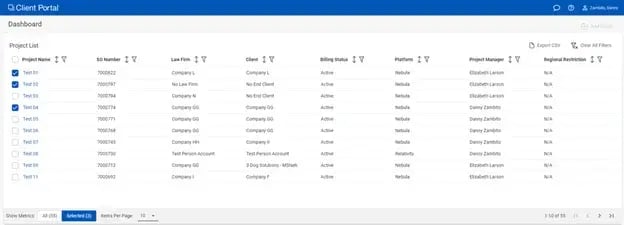
You can now select individual projects from the dashboard. Selecting the check boxes next to the project name will update the metric tiles to only display metrics for the project(s) you selected. You can use the “All” or “Selected” view toggles to switch back and forth between all projects on the dashboard or only what you selected.
-
We have introduced multi-series charts for metrics. This feature is currently available for Professional Services and Managed Review hours and will be made available for other appropriate metrics in the future. You have the ability to do stacked bar charts, line charts, or “side by side” bar charts.

-
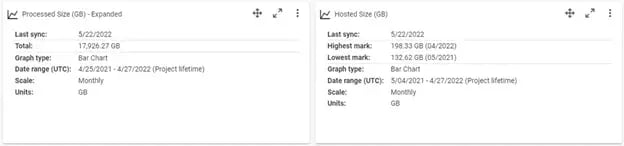
The “Info button” on graphs will now display aggregate info. For cumulative services, like processing, it will show the sum total. For hosting and users, it will show the high water and low water marks.
-
Improved detail when downloading a .csv from a metric tile on the dashboard. When you download a csv from a metric tile on the dashboard, it breaks out each project’s contribution to that metric for each time period in the range.
-
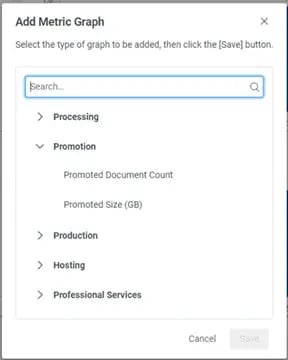
When selecting a metric to add, categories are grouped and there is a search bar to find the metric you want. This will make it easier to navigate the list of available metrics.