
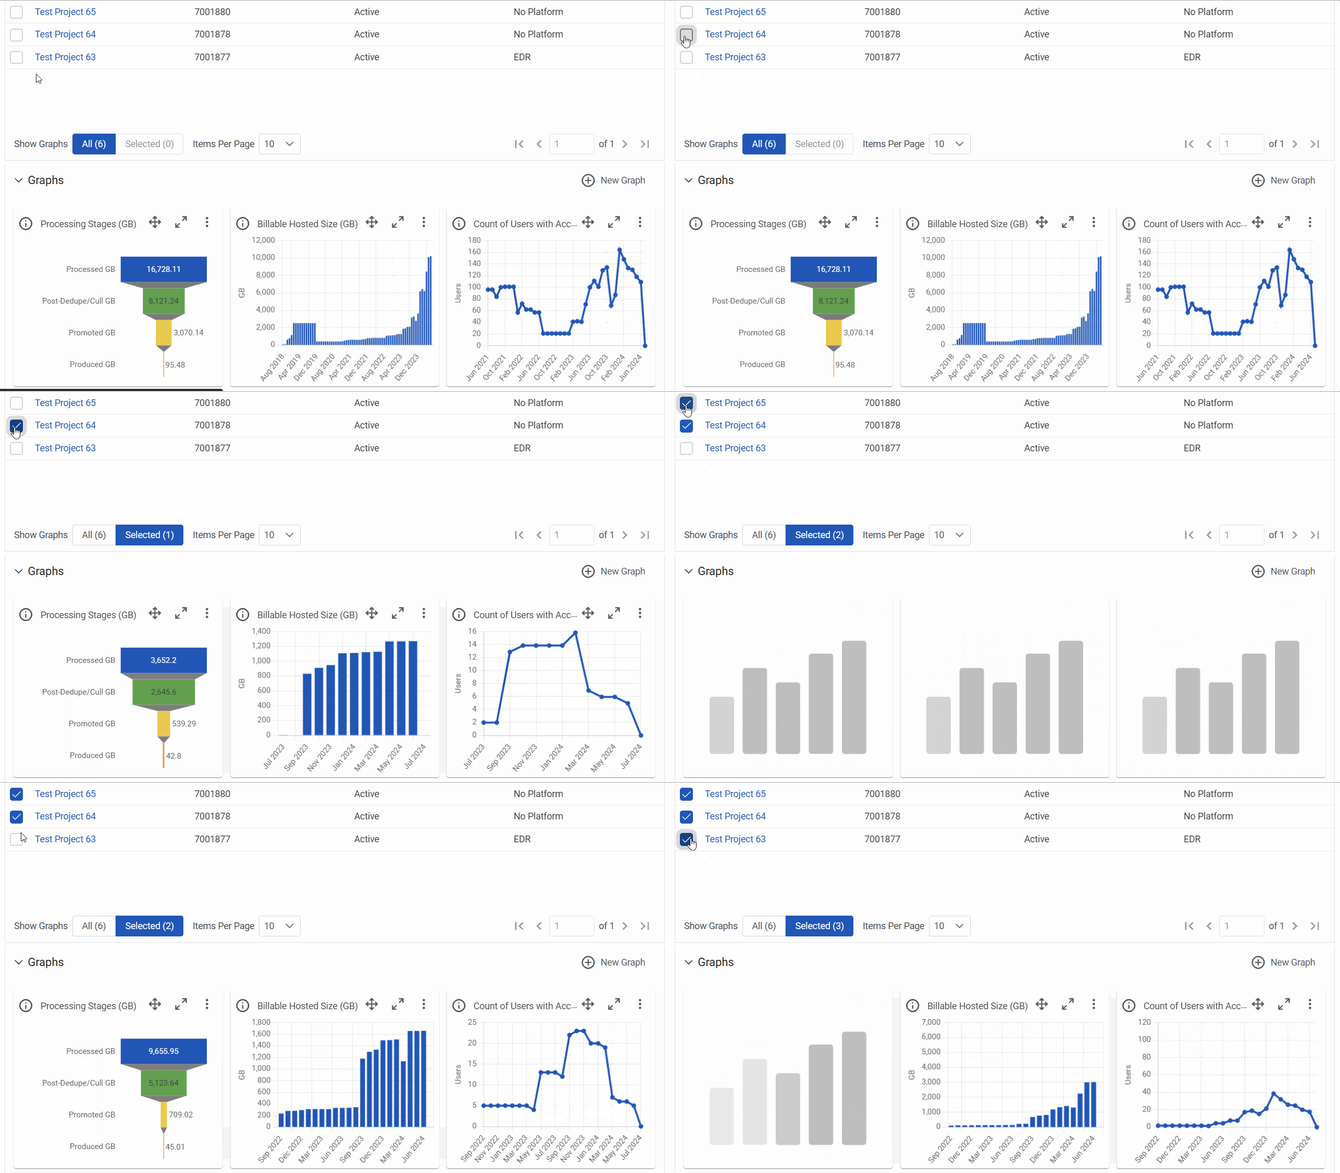
Metric graphs can be used at both the Dashboard level to display information about multiple projects, and the Project level to display information about single projects. At the Dashboard level, graphs will display metrics about all of the projects that you have access to by default. As you select projects using the checkboxes on the Project List or filter projects using the fields available on the Dashboard, the Graphs section will update to display metrics for only those projects.
Learn more about Metrics: